S-World UCS -QE & EEE Scores
S-World UCS – QE & EEE Scores
For every game there needs to be a score, be it the owner of The Window Factory conducting real business or Aamina a 17 year old girl in Ethiopia, who via the extensive education applications within S-World UCS is learning English, studding, taking exams, familiarizing herself with the business systems and looking to find which industry which she enjoys and excels at, hoping her score will see her recruited to a resort network, science or network city. I appreciate most in Ethiopia do not have a computer let alone internet access, however this point is covered within the second and third American Butterfly books, within “Angel POP.”
The score for S-World UCS is not simply how much money one accumulates, this is of course important, but as important is a companies or individuals EEE and QE Scores.
The EEE (Ecological Experience Economy) score takes into account a number of factors: Ecology, Research, Philanthropy, Sports Media & PR, Systems Knowledge, Consumer Rankings, Suppliers EEE Scores & Other Items.
The QE (Quantum Economic) score is a company’s or individuals “Profit vs. Revenue Ratio” percentage.
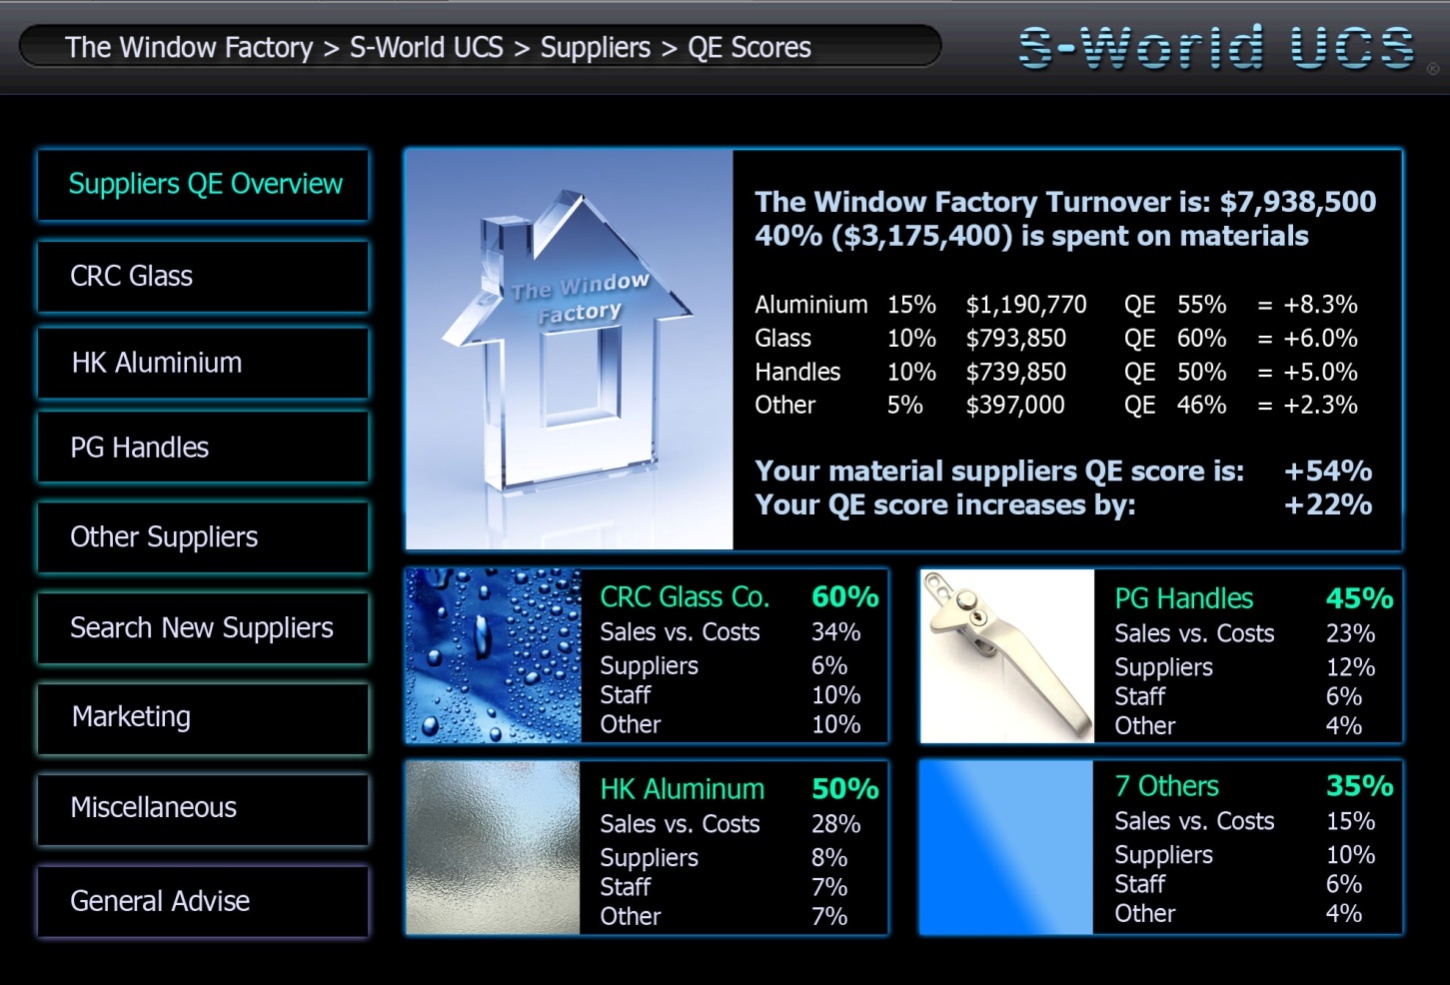
Below, once again we see the Profit vs. Revenue analysis for The Window Factory as seen in chapter two, presenting a total QE Score of 58.9%, which tells us, for every dollar The Window Factory receives 58.9 cents will be made in profit by the network. Split into five profit centers: 30.8 cents directly via “The Window Factories” sales, 21.6 cents via their materials suppliers, 2 cents via their media and marketing companies, 2.1 cents from staff and 2.4 cents on miscellaneous items
The Window Factories 30.8% score is simple; The Window Factory received $7,938,477 in revenue and generated $2,441,125 in profits. The profit is divided by the revenue equaling 30.8%.
At 21.6%, the second largest contribution is made via their material suppliers, in this case we have three main suppliers of Aluminum, Glass and Handles.
Within the set up of each resort network cube (8 mother networks close to each other), all businesses types within the construction industry including material suppliers will be recruited. These new business will be working the exact same suppliers butterfly model, supplying their own individual components. As such, when The Window Factory makes an order from a company in the network that supplies glass, then, this company will have a similar QE Score.
This being so and lowering the average QE score a little to 54% of the $3,175 391 spent on supplies 54% will be recorded as network profit, to one company or another. So we divide the $3,175 391 spent on supplies by the estimated average 54% QE Score of the suppliers, leaving $1,714,711 in profits for the network, 21.6% of overall revenue taken.
At this point we add the Window Companies $2,441,125 in profits which created the initial QE Score of 30.8% to the Window Factories material suppliers, adding a further 21.6%, where-after via the same principle, we add the smaller additions from media, staff and miscellaneous spending, increasing network profit by 6.5% adding up to the Window Factories overall QE score of 58.9%.
Initially the QE Score was considered as a way to keep track and optimize network profit within renewable energy projects. For instance, if the network was to invest build a giant dam that cost $2 Billion to build, how much would network companies make in profits in the process of building it?
However, on conceptualization it was adapted to look at tenders, collectively, a typical resort network may spend $2.5 Billion on various construction activities.
If within the resort network, all companies have a collective QE Score of 54%, then, on average, from the initial investment money, the various network construction companies and their suppliers will have generated $1.35 billion in profit. This profit alone, is enough to cover the profit required for the first three years of all Baby POP and network expenses: $200 million in year one, $400 in year two and $600 million in year three. Leaving a further seven business sectors of equal size to generate additional profit, or just get settled in.
S-World UCS Interface
Below we see how S-World may present various statistics to users, in this particular window, “Suppliers QE Overview” we are looking at the suppliers QE scores, which range from 46% to 60%, obviously in terms of improving the window factories overall QE Score, changing to suppliers with higher scores raises the window factories total score, however QE scores are just one element, price, consumer ratings and EEE scores are all important.
Staff QE Scores
Before moving on to EEE scores, we shall examine the QE scoring for staff and in so doing explore the very heart of S-World’s Economics: “The analyses of transactions made by every person every day.”
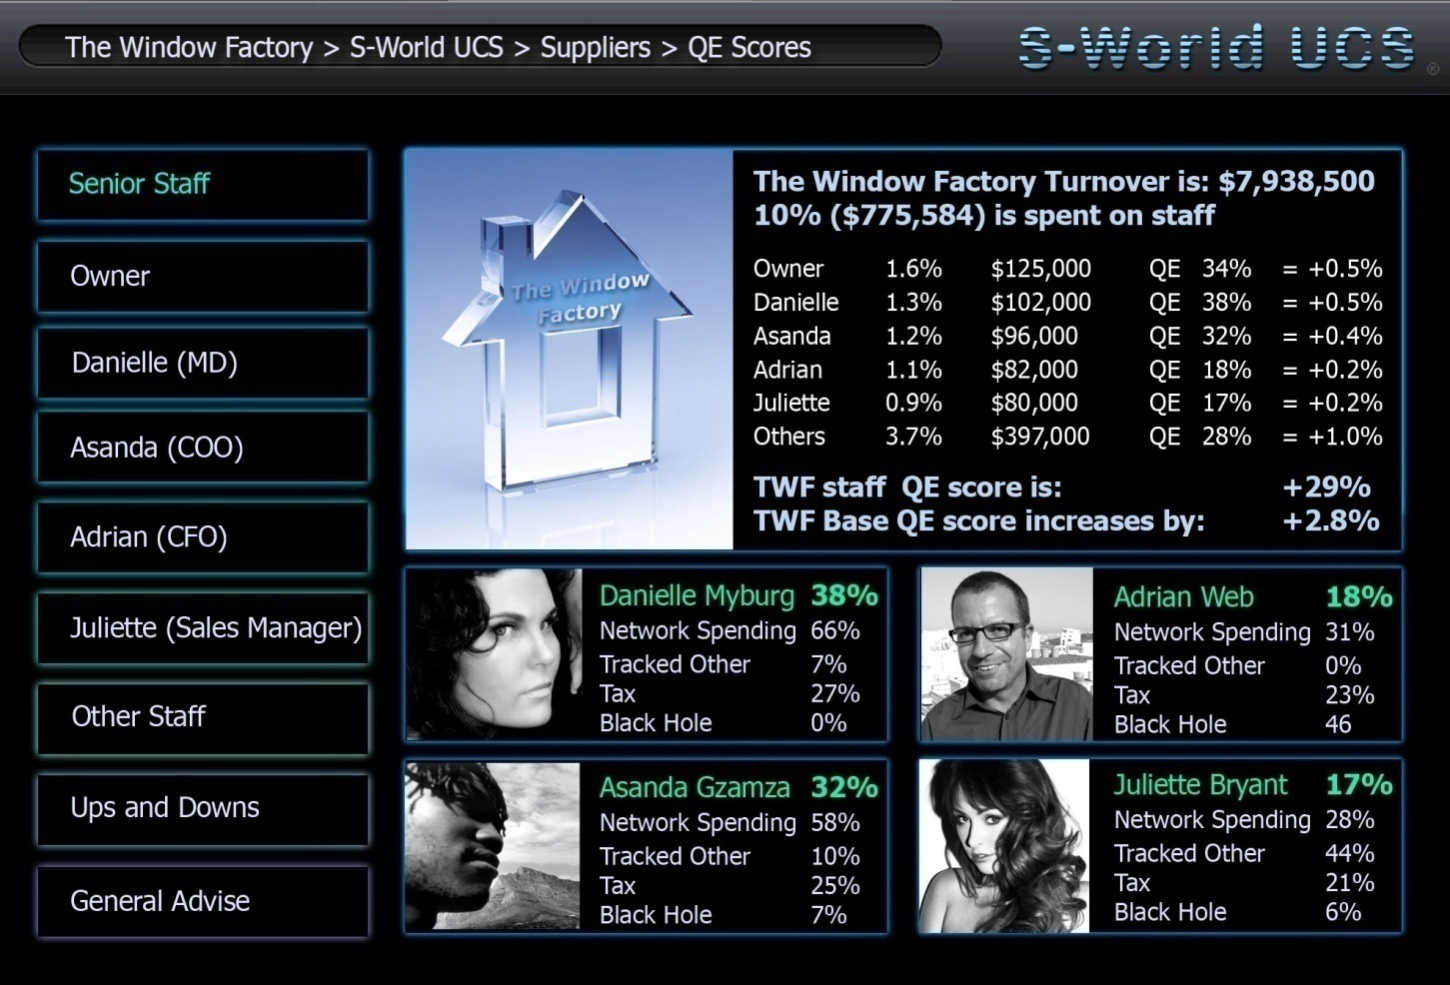
In 2018 the Window Company is forecast to spend $7,938,500, 10% of which is on staff, in the example above we see that of the 10% of revenue spent on staff 2.8% is turned into profit for various network companies.
Staff spending is broken down into 4 sectors.
Network Spending: Money spent on goods services and shelter directly from network companies.
Tracked Other: Money spent on goods, services or shelter directly from other companies, in such a way as it can be tracked, for instance goods purchased via a network affiliated bank card, or a mortgage paid via a network affiliated bank.
Tax: Is all taxes paid.
Black Hole: Is cash spending, or spending via financial institutions not affiliated to the network.
Please Note: Staff members “QE” and “Black Hole” scores directly affect their bonuses.
Please Note: In 2018, the Window Factory financial forecast predicts that profit share would be equal to basic salaries. Profit share and bonuses are always paid via Network Credits; this being so, all staff will have spent a degree of their income on network goods, services or shelter.
Analyzing individual Staff QE Scores:
Danielle Myburg: Danielle has the highest QE Score at 38%, Danielle spent 66% of her income on network goods, services and shelter. Each purchase Danielle makes is multiplied by the QE score of the supplier she purchased from, be it the house she lives in or her weekly shopping. To gain her 38% QE score, on average the companies she transacted with would have had a 58% QE score.
Danielle spent 66% x 58% = 38%. Note, the higher the QE score of the business Danielle purchases from, the higher her score will be.
In this example we are highlighting Danielle as the “poster girl” for QE scores; she really cares about it and is proud of her high score, either as it awards her a higher bonus, it impresses the boss and indeed the system, or she is simply in tune with the overall ecological, economic and philanthropic goals, most likely a combination.
With a “Tracked Other” score of just 7% and no “Black Hole” score, it is expected that Danielle lives within a resort network, so housing and most daily expenses generate profit for network companies.
Asanda Gzamza: By the looks of things Asanda also lives within the resort network, or at the least lives in a house or apartment built by the network in the greater local community. Asanda is not as clinical as Danielle with his spending, but still has a respectable QE Score.
Juliette Bryant: Juliette lives outside of a resort and likes where she is living; there are no “outside” developments in her town, albeit the system records Juliette’s interest to purchase a house in her local town, if there is enough interest, a development will be built, from a handful of houses to a Golf Estate.
Juliette will be penalized for her lower network spending, but as for the best part she is using network affiliated financing she lowers her penalties. Added to which she has the option to mitigate her losses by earning e$ (EEE Dollars) (EEE = Ecological Experience Economy)
Adrian Web: Adrian spends little of his spare money on network purchases and is not using a network bank hence a QE score of 18% and a Black Hole rating of 46%, this is not good.
The low network spending decreases profit for all, and in so doing slows down the ecological, medical and philanthropic initiatives, alongside decreasing the profit for the Window Factory, which in turn decreases the profit share for Adrian and his colleagues.
The high black hole score limits the PQS’s ability to count and so predict/enact/control future growth or decline, alongside which, money could be falling into the wrong hands.
The spreadsheet below illustrates the effect QE and Black Hole statics has on profit share allocations, this however is the starting point, where-after other factors, such as EEE scores and general performance contribute.
In this example all four employees have the same $70,000 basic salary and the bonuses pot is $280,000.
Firstly the salary is multiplied by each staff members QE Score, this figure is then pro rata increased so as to account for the entire bonus pot. (Bonus Sub Total 2)
From here the bonus is multiplied by each person’s “Black Hole” score, which is then recorded in “Bonus Deduction” This figure, is deducted from staff salaries and donated to a “Special Project” of the staff members choosing.
Lastly tax is calculated before arriving at the take home figure.
As we can see, having a low QE score and a high Black Hole score dramatically affects bonuses, Adrian receiving a $16,000 bonus in comparison to Danielle who receives $101,000, indeed Danielle has benefited from Adrian’s losses.
At the same time $30,777 has been raised for “Special Projects” Ecological or Philanthropic projects which will be detailed shortly.
Fortunately for Adrian QE scoring only affects 50% of the bonus pot, EEE scores directly address the other 50% before performance statistics then affect the sub total.
EEE Scores (Ecological Experience Economy)
Retrospective note: The exact process for defining EEE Scores and awarding EEE Dollars ($e) is a fluid concept, to be defined and redefined, the following extract is the first ever consideration, within which certain parameters and priorities may be altered when creating the working system.
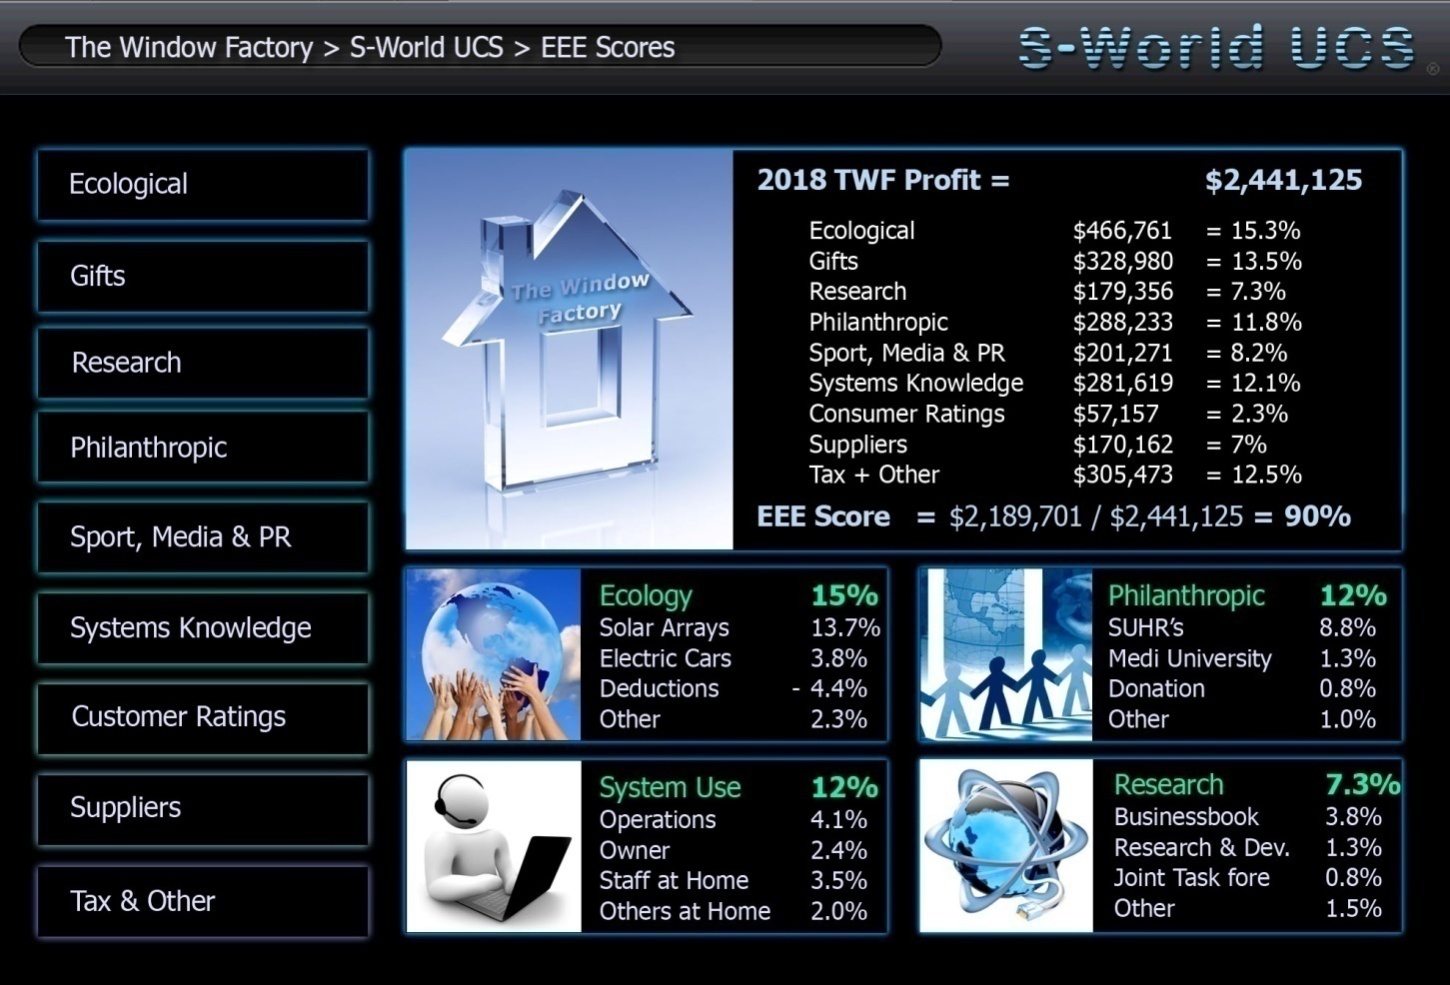
EEE Scores are designed to encourage companies and staff is many areas, from ecological investment to physical fitness. In the graphic below we see The Window Factory has made $2,442,125 in actual profit, below this figure we see the 9 sources of $e (EEE dollars) which tally to $e 2,189,70
To obtain a company’s EEE score the collective scores of the company and its staff are divided by the company’s profit, which in the case of The Window Factory gives them an EEE score of 90%, in the future other parameters may be added, but for creating an immediate stating point, we use $e ÷ profit.
In general 90% is not a good score, and so certain tenders will not be available for the Window Factory. When we consider one tender, as outlined in the suppliers butterfly created half of the $129 million profit collected by The Window Factory from 2014 to 2036, missing out on any tender due to a low EEE score costs the company and its staff a vast amount of money, as such, all will be incentivized, at least financially to improve their EEE score.
The Window Factory e$ Breakdown
In this example roughly 50% of the Window Factory’s e$ are earned via their Give Half Back network and special projects contributions, (for more detail, see “Baby POP” American Butterfly 2 & 3) including investment into renewable energy, staffing the SURH (Super University Resort Hospitals) and staffing the university and operation centers.
Before delving in, a couple of points on the spreadsheet should be clarified, EEEP is the percentage contribution from an individual item/row to the total company EEE Score, below we see in row “a” with an EEEP of 13.7% as such 13.7% of the Window Factories collective EEE score of 90% is earned by the building of solar arrays or other renewable energy devices.
Another important factor is the M column, this is the multiplier, to encourage and reward mandatory and additional investments into renewable energy, for every actual dollar spent 4 e$ are rewarded. Further down we see to assist the sending of gifts by businesses, each dollar spent returns 3 e$, where after Research and Philanthropic spending has a multiplier of 2.
Ecological: In the ecological category above rows “a” and “b” are specific to the “Give Half Back” investments into solar arrays and electric cars. Row’s “c” and “d” are the amount spent on power and fuel which act as a negative. Lastly row “e” represents various ecological endeavors performed out of office hours by the business owner, staff or their families, such as recycling.
Gifts: The gifts category is simply the amount of business to client gifts sent or received.
Research and Development: In the research category, rows “h” and “I” are specific to funding S-World Operations and the Research & Development department at the University. “j” The “Joint Taskforce” indicates that a collection of network companies have joined together to invest in a specific type of research. Row “k” represents staff family and friends rendering parts of the local area in S-World, which has contributed nearly 10% of The Window Factories score.
NOTE: If instead of The Window Factory a dedicated Pharmaceutical, Software Development or Research Company were to be measured in this category, they would have a high score based on their achievements.
Philanthropy: In the philanthropy category rows “l” and “m” are specific to SURH’s investment (Medicare & Medicaid alternatives), “n” is a simple charity donation and “o” represents volunteering work performed by the owner, staff or their families.
Sports Media & PR: Row “p” signifies the Give Half Back funding to the university Sports, Media and PR Department.
Row’s “q” & “r” present opportunities for companies to acquire a significant amount of e$ by encouraging the company and staff to assist the operation centre media department in the making of adverts, productions, local network documentaries, or reality TV shows, be it in front or behind the camera.
Equally the participation in network sports leagues is rewarded.
Retrospective Note: For various reasons investment into sports and media has since been substantially increased see Angel POP within The Network on a String.

Consumer Ratings (The per human results search engine): In Consumer Ratings the average rating achieved is multiplied by the amount of goods sold, then multiplied by 0.1%. This does not leave a particularly significant figure, however as consumer rating are available for the public to see, motivation to excel in this department is already encouraged.
Systems Knowledge: like “Sports Media & PR” systems knowledge is another “without cost” way to gain e$. In row ”t” we see the amount of hours all staff have spent using any S-World systems at the office, not specifically the hours logged on but a combination of hours vs. key stokes vs. moving in a direction that makes sense.
Achievements are the completion of certain tasks, such as creating partnerships or adding something to the system that is to the benefit of the network. Exams are simply e$ rewarded for passing exams.
In row “v” staff working from home, generates the highest figures, here staff are encouraged to play the S-World UCS game/simulation version of The Window Factories real life business activities. Taking the virtual company to the next level and beyond, making partnerships, applying for tenders and expanding overseas, taking the company to new heights or on occasion new depths if ones strategy did not work out.
To quote Schrep, Facebook VP of Engineering: “Get out there and try something, and don’t be afraid, there are lots of people to catch you, and you will never get criticized for trying something for the right reasons and making a mistake”
Via S-World UCS one can make mistakes, take risks and try new things without costing the company a cent, and when something pays off, it can be brought to the attention of boss and company hierarchy as a strong consideration of the next real life step.
In row “w” we see the “Others at Home”, this is a collection of either friends or unknown game players who have asked or been asked to play S-World UCS under The Window Factory” banner. In many cases this will be someone in the local area wishing to either work for a company within the local network, someone who wishes to apply to start their own company, or become someone who wishes to be a network agent.
Add that to friends and family and Facebook friends, S-World VSN users and S-World.biz users and pretty quickly one can have a lot of people playing out future business possible parts, all contributing to the advisement of the decision makers.
Retrospective note: to further increase simulation usage, alongside sports and media, substantial extra funding in terms of resort credits is made available to encourage usage in this sector, the basic principle being that whatever score one attains within the simulation will be rewarded with a pro rata percentage of network credits.
The suppliers Score: takes the amount of real dollars spent with each supplier multiplied by the suppliers EEE score, and then multiplied by their QE score then multiplied by 0.1
Others: Finally the Tax and Other includes, Tax paid multiplied by 0.25 alongside “Give Half Back” University Staff and Building Budgets, alongside a collection of smaller inputs. Note in particular the relatively high score that paying tax gives; this is deliberate, rewarding the company for their contribution.
As an economic solution, the system looks strike an balance between tax efficiency and network profitability, higher taxes may see a higher multiplier or 0.5, to motivate in such circumstances, especially if the country receiving the tax is enacting an extended infrastructure project using network companies construction companies.
Total: In total the company made $2,44,125 in profits and $e 2,191,435 so generating a 89.9% EEE Score.